Example of PLSA implementation
Visual Studio project for full scale demo of PLSA using PATENTCORPUS128
Probabilistic Latent Semantic Analysis
pLSA was introduced by Hofmann in 1999. Given data is document-term matrix and number of presumed categories (2 in this example).| doc/word | w1 | w2 | w3 | w4 | w5 | w6 |
| d1 | 9 | 2 | 1 | 0 | 0 | 0 |
| d2 | 8 | 3 | 2 | 1 | 0 | 0 |
| d3 | 0 | 0 | 3 | 3 | 4 | 8 |
| d4 | 0 | 2 | 0 | 2 | 4 | 7 |
| d5 | 2 | 0 | 1 | 1 | 0 | 3 |
The result is computed two matrices and a vector with the meaning explained below:
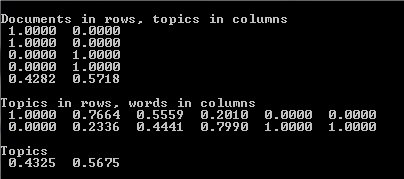
If we presume that our collection has two categories we may notice that upper two documents belong to one of them, next two document belong to another and last document almost evenly present words from these two categories. That is shown in the first matrix. The documents are shown in rows and the categories in columns. The matrix value is a probability, with which a particular document belong to a particular category.
Second matrix is distribution of the categories for each individual word. We can see that first word and last two are met only in one category and the others are shared between them. The last vector is probability for each category. If we make diagonal 2 * 2 matrix and assigned values of the last vector to diagonal elements we can construct matrix product similar to singular vector decomposition PLQ, where P is the first matrix and Q is the second.
Theoretical explanation of PLSA can be found in many papers published online. There is no need to repeat it here. The simple example shown on the top link is applied for the above data. The next link is application of PLSA to the real data. The result obtained on the real data does not look that impressive as this small and clear example. The accuracy in only near 40 percent.