Grid models
The grid models of dynamic systems are based on discrete Urysohn model. These models have a grid structure with parameters sitting in the nodes. The reason to call them grid models and not Urysohn, is because they are more generic and Urysohn model can be only a part of it. Here is the demo of capacity of grid models.The power of the grid structure in modelling of nonlinear objects
Let us consider not so simple dynamic object with relay input. The object has two inputs (xi, yi) and one output (zi). The inputs take discrete values, any of (1,2,3,4,5,6,7,8) and the output is a sum of 8 consecutive inputs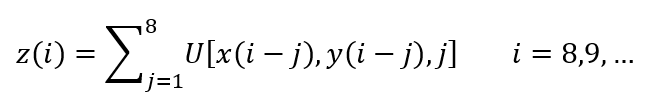
Technically, it is two dimensional discrete Urysohn operator, but physically it is a 3D grid U[x,y,j] of size 8*8*8 with values in nodes. For this test we assign grid values either +1 or -1, similar to collection of chess boards
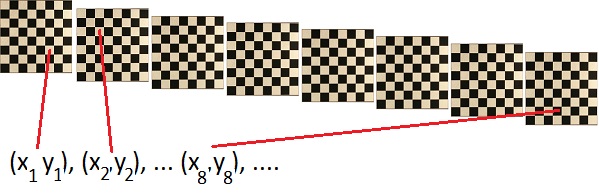
The input pair uniquely determines the cell in the chessboard and the color of the cell adds either +1 or -1 to the output. The output, in this case, is sequence of integers from the list (-8, -6, -4, -2, 0, 2, 4, 6, 8).
The challenging task is to identify grid U[x,y,j] having only recorded inputs and outputs. Also, not only to identify grid, but to perform online identification, that means build the model in real-time by tuning the grid while reading input/output pairs.
Here we claim the algorithm which not only allows this online identification, but needs about 20 lines in software code and returns the exact result after reading of 3000 input/output pairs. 3000 data readings hold 9000 parameters and that is enough to accurately identify 8*8*8 = 512 grid values.
This article is an elementary demo of the capacity of the algorithm discovered and published by Mike Poluektov and Andrew Polar. Here is the CODE, here is theoretical ARTICLE.
The capacity of filtering errors in data
The object in previous section is not typical, it can't be an airplane or a boat. All inertial objects like planes and boats have one common property: small differences in inputs cause small differences in outputs. It is possible only if grid parameters make a smooth structure, which means that difference between adjacent elements is significantly smaller than a difference for distant elements. Such structures have phenomenal capacity in filtering errors in data.Here is the accuracy test. The object has one input and one output. The grid structure is generated randomly at each run, but it is always smooth. The image of the grid is shown below.
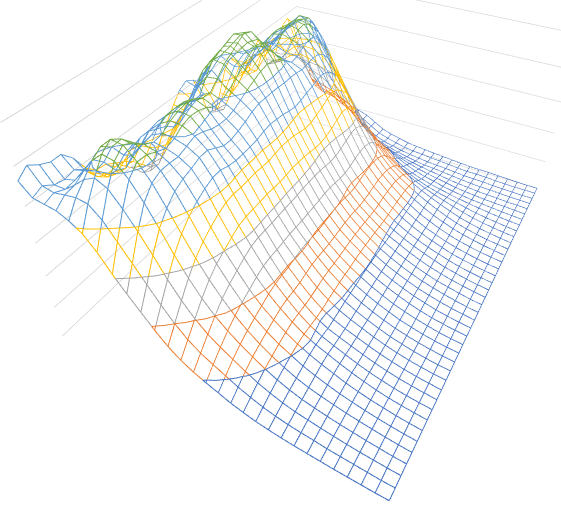
The input data was distorted, the errors correlated with input were added. The range for the errors was 20 percent of the range of signal and pearson correlation coefficient between errors and input was near 80 percent. These errors were effectively filtered. The root square error between modelled output and actual output was near 1.5 percent.
The linear model was also tested for comparison. As it was expected the linear model failed, the root square error was near 25 percent due to nonlinearity of the object.
Mar, 2019.